B2B Lead Generation Services
Helping technology marketers reach the right buyers, generate demand, and drive pipeline.
Explore All →


Who We Serve
Helping technology marketers connect with the right buyers in competitive markets.
Explore All →


In my last post, Storage Education and Learning Resources for VMware Admins, I provided numerous resources for VMware Admins to get up to speed on storage. Whenever you think about storage, and the rest of the infrastructure in the datacenter, you should always keep in mind that the reason it exists in the first place is to run your company’s applications. After all, it’s those business applications that pay for the servers, storage, and even our salaries. Thus, it’s in our interest, and the company’s best interest if we can find ways to keep application owners and end users happy. Unfortunately, most virtualization monitoring tools have little application insight. So how do you know that the storage tweak you made, the expensive new array you put in, or the new flash caching actually helped the applications run faster?
Here are five tips that can help you, as a VMware admin 1) keep application owners happy and 2) help you to prove that your work really improves application performance.
Application performance is going to be determined (in most cases) by the resources that the OS and application have to work with. Those resources are:
Note: storage capacity is also a resource but it doesn't have an effect on performance unless you run out of it. Still, it should be monitored to ensure that doesn’t happen.
If any one of these resources becomes constrained then your application performance will start to degrade. For example, when physical memory is depleted on a vSphere host, the host will use compression and then swap memory out to disk. Since disk is slower, the memory performance will be slower, resulting in slower application performance for the VMs running on that host.
If there is an increase in storage latency for a particular vSphere datastore then the VMs stored on that datastore will experience application performance degradation.
Do you know what the normal resource utilizations are for your virtual machines and hosts? Do you know what the normal storage latency is to your shared storage? These “norms” when application performance is acceptable are called “performance baselines”. You should know what the baseline performance metrics are so that if you have a performance issue, you can identify which metrics are out of the normal range.
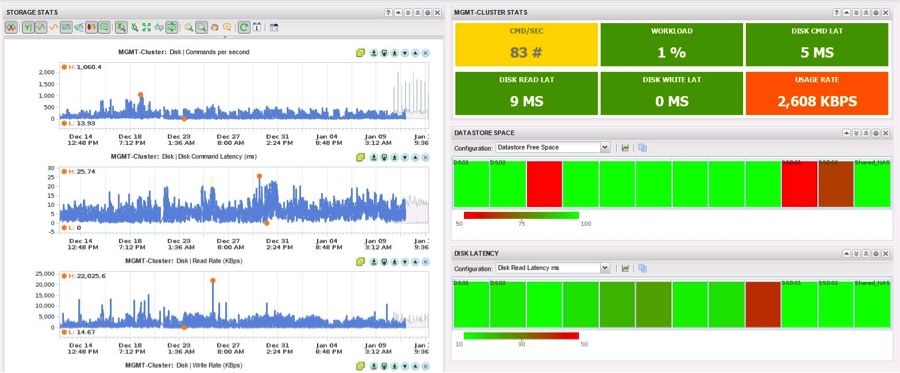
To monitor these types of performance statistics and to monitor capacity over time, every virtualization admin should have a virtualization performance / capacity tool in place and - most importantly - USE IT FREQUENTLY. All too often tools are purchased but not implemented or are implemented but simply ignored until there is an issue. While the tools may help to solve the problem during “fire fighting mode”, you’ll spend much more time and energy to find the problem. Additionally, if the tool had of been used properly before the problem, most performance issues can be prevented.
Examples of virtualization performance monitoring and capacity analysis tools are:
Too many “infrastructure people” couldn’t care less about the applications that actually run in the datacenter. They don’t want to learn about them, they don’t want to talk to app owners or end users, and they only see apps in terms of their resource utilization profile. In my opinion, this is a mistake
Almost every company has in-house enterprise applications like Microsoft active directory (AD), Exchange Server, SQL, and others. Many companies have in-house applications that they have developed or have purchased, just for their industry and use-case.
I encourage you to take the time to learn about all these applications and get to know the application owners. By understanding the purpose, criticality, dependencies, financial impact, and data flow of your company’s applications, you’ll be more successful at achieving availability, performance, security, data protection, and disaster recovery (and being successful in your job).
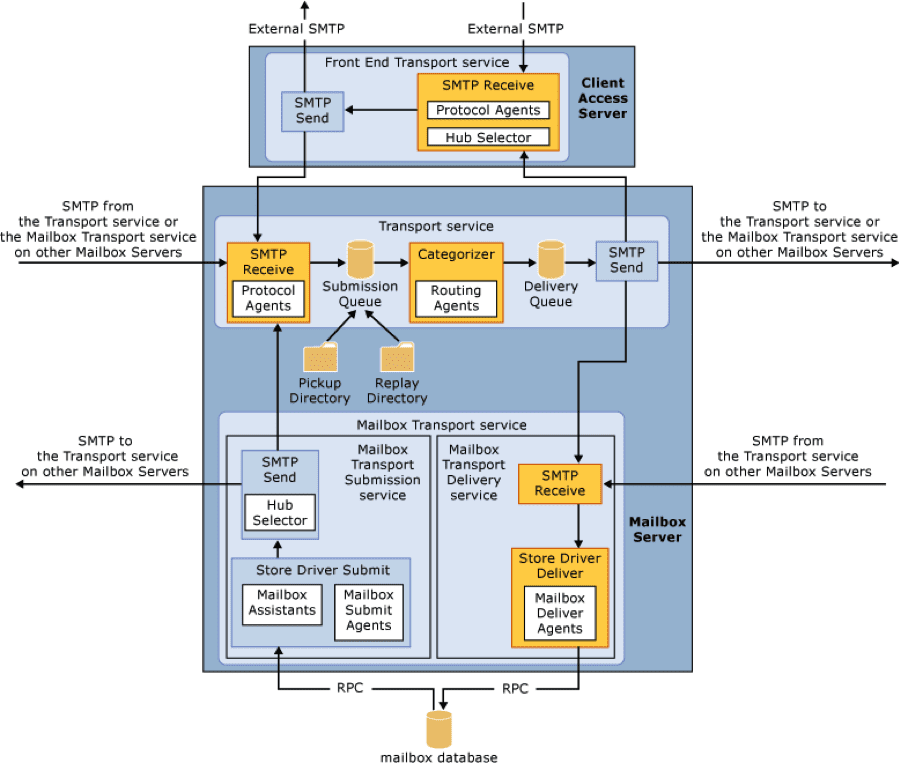
For example, what does your mail server need to function? What are all the dependencies? What would be the financial impact to your company if email were down for, say, 1 hour?
Once you understand the critical applications at your company and their financial impacts, you’ll realize that you are in a unique position to improve application performance with the resources available to you in the datacenter.
To show that you have or have not improved application performance, you’ll need real metrics. While those may be available with many of the enterprise applications, they can be difficult to obtain. Additionally, when you obtain them you are usually doing it for a one-time project on a single host, or handful of hosts.
In order to monitor application-level metrics across the entire datacenter, you need to look at application performance monitoring tools (APM).
Some of the popular application performance monitoring tools available are:
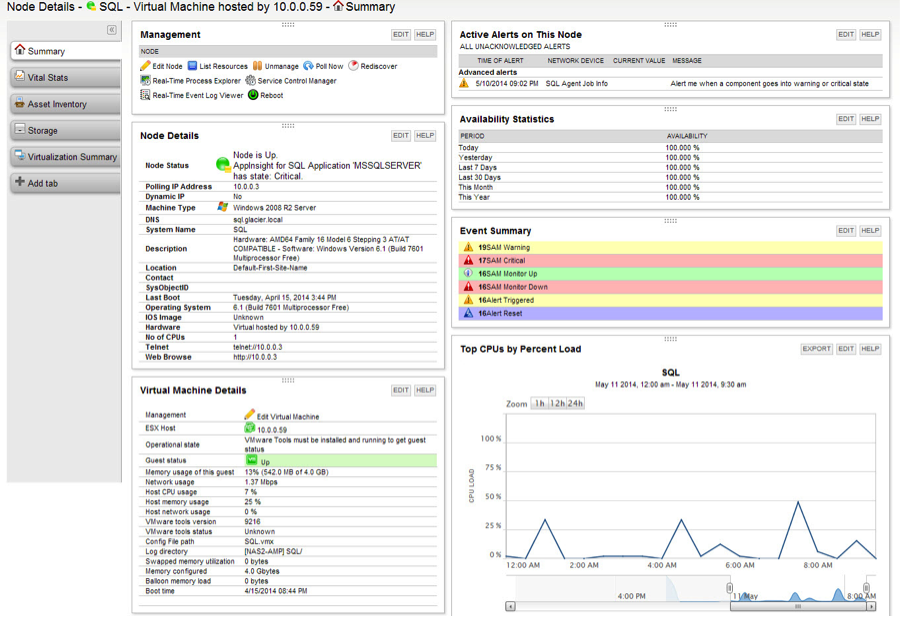
For example, here you see Solarwinds SAM showing SQL performance data-
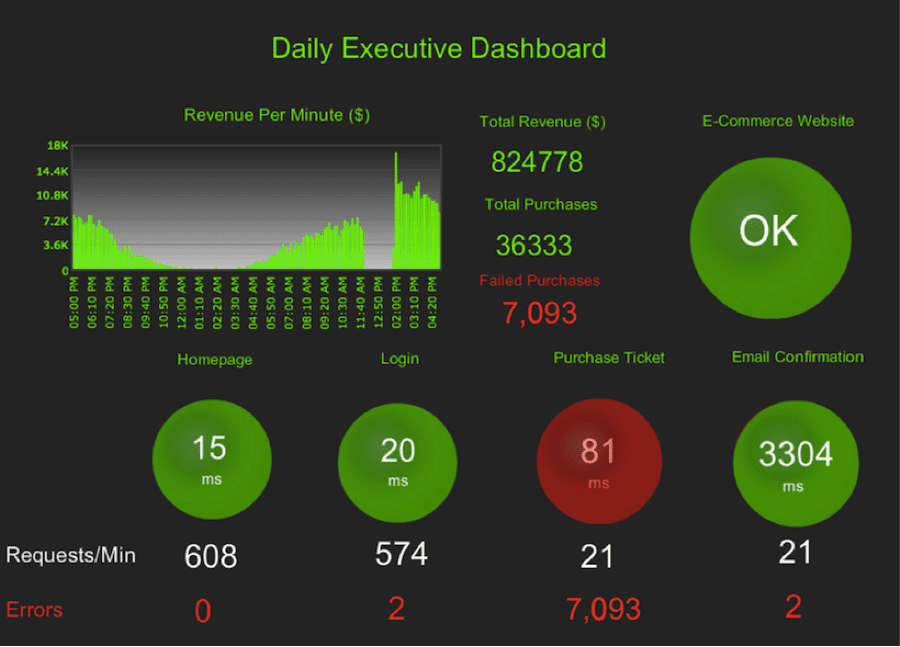
One of the main features to look for in whatever application monitoring system you implement is the ability to easily share data with application owners. Even better are custom dashboards that you can create to show, for example, company executives the status of all critical enterprise applications, as you see in Figure 4 below.
This way, the application owners and executives don’t have to come to you to ask for information nor will they ever “point the finger” at you when there are application issues (unless it is deserved, which the report data will prove).
With server consolidation using virtualization and increased density of servers (compute and memory), application performance today is more dependent on storage I/O and latency than ever before. For that reason, many companies have been looking to flash storage to improve application performance. One of the popular uses for flash is to install it in vSphere hosts for caching. The downside to that of course is 1) the cost of the flash and 2) the downtime to install it.
One vSphere caching solution I’ve found is fascinating because it requires no hardware to install, requires no downtime to deploy, and offers a free fully functioning evaluation. That solution is Infinio Accelerator.
Infinio’s version 2.0 adds several capabilities to help you better understand your storage performance per virtual machine (which usually maps to a single application). For each accelerated datastore, Infinio offers analysis of storage I/O on a per-virtual machine basis, such as which VMs benefit most from caching, and which are generating the most I/O.
For example, here you see a breakdown of the top virtual machines on a datastore, ranked by top I/O reads.
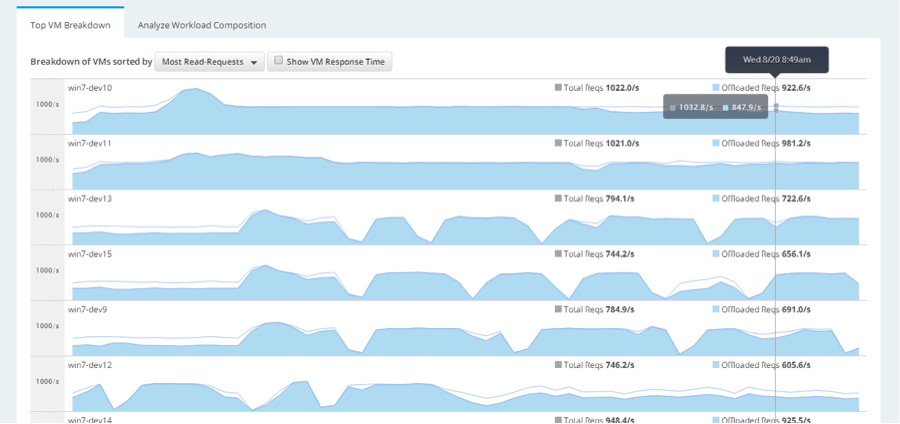
Figure 6
You can sign up to be notified when Infinio Accelerator 2.0 goes into beta here: http://bit.ly/1p7lCJE
No longer should you think about simply buying more CPU, memory, or disk. Instead, ask yourself – what can I do to improve application performance? After all, if you think about it, improving application performance is one of the most important things that we can do for the company. And remember - to measure the effect that you have on application performance, make sure that you have the right tools in place!